IELTS Writing Task 1 Pie Chart band 7 model is for Academic IELTS candidates who can describe numbers but are not sure how to turn a pie chart into a clear Band 7 report. A pie chart answer is not a sentence-by-sentence tour of every slice. It is a short comparison report that identifies the largest categories, the smallest categories, the main differences, and any useful grouped patterns. Before you write another practice answer, take the IELTS Express Pre-Test to check your current Writing band range and see whether overview quality, selection, vocabulary, grammar, or timing is holding you back.
In this guide, you will see a complete Band 7 pie chart model answer and the thinking behind it. The aim is not to memorise impressive phrases. The aim is to make simple decisions quickly: what should go in the introduction, what belongs in the overview, which figures deserve detail, and how to compare categories without sounding repetitive.
What Band 7 Means For A Pie Chart
Band 7 in IELTS Writing Task 1 usually means the report presents the main features clearly, includes a clear overview, organises information logically, and uses a good range of language with mostly accurate control. You do not need perfect English, but the examiner should immediately understand the main picture.
For pie charts, the biggest Band 7 skill is selection. A weaker answer lists every percentage in the order it appears. A stronger answer groups the data and explains relationships: which category dominates, which categories are minor, which two figures are similar, and whether the pattern changes across two charts.
- Identify the largest and smallest slices first.
- Group similar categories instead of listing everything separately.
- Write a clear overview before detailed figures.
- Use percentages accurately and sparingly.
- Compare categories with simple, controlled language.
The Band 7 Pie Chart Structure
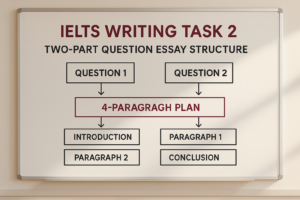
A reliable pie chart report has four short paragraphs. The first paragraph paraphrases the task. The second gives the overview. The third describes the biggest or most important categories. The fourth covers the remaining categories or the main contrast between charts.
This structure works because it makes your answer easy to mark. The overview appears early, then the body paragraphs support it with selected data. You avoid the common problem of writing a long list of percentages with no clear message.
For wider Task 1 practice, use the IELTS Writing Task 1 practice test after studying this model so you can apply the same structure to line graphs, tables, bar charts, and mixed charts.
Sample Pie Chart Task
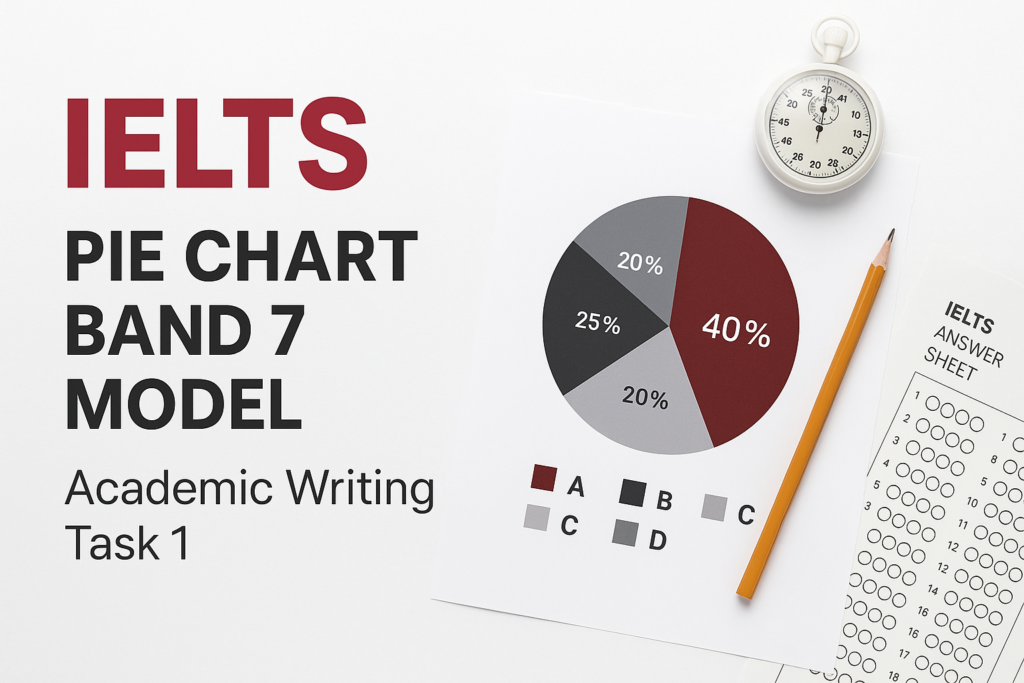
Imagine the pie chart shows how university students in one city spent their monthly budget in 2025. Rent accounted for 40 percent, food for 25 percent, transport for 15 percent, entertainment for 12 percent, and study materials for 8 percent.
This is a simple single-chart task, but it still needs selection. A Band 7 answer should not treat every category as equally important. Rent is clearly the largest expense, food is the second-largest, transport and entertainment are middle categories, and study materials make up the smallest share.
The main story is that essential living costs took up most of the budget. Rent and food together accounted for almost two thirds of spending, while study-related costs were much smaller.
Band 7 Model Answer
The pie chart illustrates the proportion of monthly spending allocated to five categories by university students in a city in 2025.
Overall, rent was by far the largest expense, while study materials made up the smallest share of the budget. Essential costs, especially rent and food, accounted for most student spending, whereas transport and entertainment represented much smaller proportions.
Rent took up 40% of the monthly budget, making it the dominant category. Food was the second-largest expense, at 25%. Together, these two categories represented 65% of total spending, which shows that basic living costs consumed almost two thirds of students’ monthly money.
The remaining categories were considerably smaller. Transport accounted for 15%, which was slightly higher than entertainment, at 12%. Study materials made up the lowest proportion, at just 8%, meaning students spent five times as much on rent as they did on books and other academic resources.
Why This Model Reaches Band 7
The model answer works because it has a separate overview that gives the main picture without drowning the reader in numbers. It clearly states that rent was the largest category, study materials were the smallest, and essential costs dominated the budget.
The body paragraphs are grouped logically. One paragraph focuses on the two largest categories, while the other covers the smaller categories. This is much stronger than writing five separate sentences that all start with the name of a category.
The data is also used to support comparisons. The answer does not simply say rent was 40 percent and food was 25 percent. It explains that rent and food together made up 65 percent, and that rent was five times the figure for study materials. If you want to test this under realistic pressure, access unlimited IELTS mock tests and check whether your Task 1 reports include a real overview and grouped comparisons.
How To Write The Introduction
The introduction should paraphrase the question in one clean sentence. You can replace shows with illustrates, percentage with proportion, and spending with monthly budget or expenditure. Do not add opinions or reasons.
A good introduction stays neutral. It does not say rent was expensive or students struggled financially unless the chart actually provides that information. IELTS Task 1 is a report, so your job is to describe the data, not explain the social causes behind it.
Keep the introduction short. In a 20-minute task, a controlled sentence is better than a long paraphrase with awkward grammar.
How To Write The Overview
The overview is the most important paragraph in a pie chart answer. It should describe the biggest pattern without listing every percentage. Ask yourself three questions: what was the largest slice, what was the smallest slice, and can any categories be grouped together?
For the sample task, the overview should mention that rent was the largest expense, study materials were the smallest, and rent plus food formed the majority of spending. Those points cover the main picture.
Avoid exact detail overload in the overview. You may include no numbers at all, or one broad phrase such as almost two thirds. Save the precise percentages for the body paragraphs.
Choosing Details For Body Paragraphs
Good detail selection is one of the easiest ways to lift a Task 1 answer. Start with the largest and smallest categories. Then look for useful groups, such as essentials versus leisure, high categories versus low categories, or similar percentages.
In the sample chart, rent and food naturally belong together because they are essential living costs and they dominate the chart. Transport and entertainment are close enough to compare, while study materials stand out as the smallest category.
If your real exam has two pie charts, compare change as well as size. Look for categories that increased, decreased, stayed similar, or swapped rank. For more help with selection and structure, read the IELTS Writing Task 1 tips and strategies guide.
Pie Chart Vocabulary For Band 7
Band 7 vocabulary is accurate and flexible, not dramatic. Useful phrases include accounted for, made up, represented, comprised, the largest share, the smallest proportion, almost half, roughly a quarter, just under, just over, and considerably higher than.
Be careful with percentage and percentage point. If rent is 40 percent and food is 25 percent, rent is 15 percentage points higher. It is not 15 percent higher. You can also say rent was considerably higher than food if you do not need that exact comparison.
Do not overuse comprised or constituted in every sentence. A natural mix of simple verbs is better than a report that sounds memorised.
Grammar Patterns That Help Your Score
Pie charts give you many chances to show controlled comparison grammar. You can write rent accounted for 40 percent, while food represented 25 percent. You can write rent was the largest category, at 40 percent. You can write transport, which made up 15 percent, was slightly higher than entertainment.
You can also combine figures when it helps the message: rent and food together accounted for 65 percent of total spending. This type of sentence shows that you can process the data instead of copying it mechanically.
The main rule is accuracy. If a complex sentence causes errors, simplify it. Band 7 needs range, but it also rewards control.
Common Mistakes In Pie Chart Answers
The first mistake is missing the overview. Without a clear overview, Task Achievement is limited, even if most figures are correct. The second mistake is listing every slice in a flat sequence. A pie chart report should compare, group, and prioritise.
The third mistake is using vague language when the data is precise. Phrases like a lot, a little, and very big are usually too informal or unclear. Use largest share, smallest proportion, slightly higher, considerably lower, and almost twice as much instead.
The fourth mistake is writing too much. Task 1 has a 150-word minimum, and a strong answer is often around 170 to 200 words. If timing is your main weakness, see our IELTS preparation plans and choose support that helps you build a realistic Writing routine.
A 20-Minute Practice Routine
Spend the first two minutes reading the title, labels, units, and categories. Spend the next two minutes choosing the overview and grouping the slices. Then write the introduction and overview before moving into the detailed paragraphs.
Use twelve minutes to write the two body paragraphs. Keep the detail selection tight. Each body paragraph should have a clear job, such as describing the largest categories first and then comparing the smaller categories.
Save the final two minutes for checking. Look for wrong percentages, missing articles, subject-verb agreement, unclear comparisons, and repeated sentence openings. A short check can protect several marks.
Final Checklist Before You Submit
Before you finish a pie chart report, check that the introduction paraphrases the task, the overview gives the main picture, the body paragraphs are grouped logically, and the selected figures support the overview.
Also check that you avoided personal opinions, used percentages accurately, compared categories naturally, and did not repeat the post title as a body heading. Task 1 is a formal report, not an essay.
An IELTS Writing Task 1 Pie Chart band 7 model is useful only if you copy the thinking behind it. Read the chart, choose the main story, group the categories, support the overview with figures, and write in clean controlled English.
Ready to find out your IELTS band score?
Take the IELTS Express Pre-Test for just $4.99 and get your personalised band prediction with a 14-day improvement plan.
FAQ: IELTS Writing Task 1 Pie Chart Band 7 Model
How do I write a Band 7 IELTS pie chart answer?
Use a four-paragraph structure: introduction, overview, first detail paragraph, and second detail paragraph. Identify the largest and smallest categories, group related slices, and support comparisons with selected figures.
What should the overview include in a pie chart?
The overview should include the main pattern, such as the largest category, the smallest category, and any useful grouping. It should not list every percentage.
How many percentages should I include in Task 1?
Include enough percentages to support the main comparisons. For a single pie chart, that usually means the largest category, the smallest category, and several important middle figures.
Can I give reasons for the pie chart data?
No, unless the chart itself gives reasons. IELTS Writing Task 1 asks you to describe and compare the data, not speculate about causes.
How long should a pie chart answer be?
A strong answer is usually around 170 to 200 words. You need at least 150 words, but writing far more can waste time and increase the risk of errors.