If you are looking for an IELTS Writing Task 1 Paraphrasing Introduction sample answer, you are probably trying to start your report clearly without copying the question. That is a good problem to fix early, because the introduction sets up the whole answer. Before you keep practising full reports without knowing your current level, take the IELTS Express Pre-Test to check your band range and find out whether Task 1 writing is one of your main score risks.
In IELTS Academic Writing Task 1, the introduction does not need to be clever. It needs to be accurate. A strong introduction paraphrases the task statement, identifies the visual, and keeps the meaning unchanged. A weak introduction often changes the meaning, adds opinions, copies too much language, or uses memorised phrases that do not fit the chart.
What The Task 1 Introduction Should Do
The introduction tells the reader what the visual shows. It normally covers the chart type, the subject, the place or group if given, and the time period if one is shown. It should be short, usually one sentence. You do not need data, trends, reasons, predictions, or personal views in this paragraph.
Think of the introduction as a clean label for the report. It prepares the examiner for the overview and body paragraphs. If the task statement says the graph shows changes in household energy use in Australia from 2000 to 2020, your introduction should keep those same facts. You can change the wording, but you must not change the information.
- Identify the visual type accurately.
- Keep the subject of the chart the same.
- Include the location, group, or period when given.
- Avoid adding reasons or opinions.
- Use simple paraphrasing instead of risky vocabulary swaps.
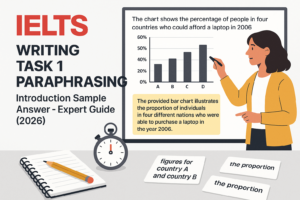
IELTS Writing Task 1 Paraphrasing Introduction Sample Answer
Here is a simple task statement: The line graph shows the percentage of households in one country with internet access between 2000 and 2020.
A strong introduction could be: The line graph illustrates how the proportion of households with internet access in a particular country changed from 2000 to 2020.
This introduction works because it changes the structure without changing the meaning. “Shows” becomes “illustrates”, “percentage” becomes “proportion”, and “between 2000 and 2020” becomes “from 2000 to 2020”. The sentence is not dramatic, but it is accurate and easy to read.
Why This Sample Introduction Is Band-Safe
A band-safe introduction does not try too hard. Many candidates think paraphrasing means replacing every word with a synonym. That is where mistakes begin. Some words should not be changed because the replacement may be inaccurate. For example, a percentage is not always the same as a number, a country is not always the same as a city, and households are not always the same as people.
The sample answer keeps the key nouns clear. It changes only the words that can safely be changed. It also uses a natural reporting verb, “illustrates”, which fits charts, graphs, maps, and processes. You could also write “shows”. Reusing one common word from the question is not a problem if the rest of the sentence is controlled.
If you want to test this skill under realistic timing, access unlimited IELTS mock tests and practise writing introductions before checking model answers.
Weak Introduction Versus Strong Introduction
A weak introduction might say: The line graph gives information about the internet in a country during many years. This is understandable, but it is too vague. It does not clearly mention households, internet access, or the exact period.
Another weak version is: The chart proves that internet access became more popular because technology improved. This is worse because it adds a trend and a reason before the overview. Task 1 does not ask you to explain why the change happened unless the visual provides that information.
The stronger version is plain: The line graph illustrates how the proportion of households with internet access in a particular country changed from 2000 to 2020. It is accurate, complete, and ready for an overview paragraph.
How To Paraphrase Without Changing Meaning
Use three safe moves. First, change the sentence structure. Second, replace only common reporting words. Third, keep technical words when changing them would create risk. This is much safer than trying to find a synonym for every noun.
For example, “The bar chart shows the number of visitors to three museums in 2010” can become “The bar chart compares visitor numbers for three museums in 2010.” That is a neat paraphrase because “number of visitors” and “visitor numbers” mean the same thing. The sentence is shorter and clearer.
However, do not change “visitors” to “customers” unless the chart is actually about customers. Do not change “museums” to “public buildings”. Those substitutions may look fancy, but they damage accuracy.
Useful Paraphrasing Verbs For Task 1
Useful verbs include shows, illustrates, compares, presents, gives information about, and indicates. Use them carefully. “Compares” works well when the visual clearly compares groups, categories, or time periods. “Illustrates” and “shows” are flexible. “Presents” is formal but still natural.
Do not overuse unnatural phrases such as “depicts information regarding” or “renders data concerning”. They sound forced and can make the sentence harder to read. IELTS rewards clear academic writing, not inflated language.
The IELTS Writing Task 1 vocabulary list can help you build useful language, but choose phrases you can use accurately under time pressure.
Introduction Patterns For Different Visual Types
For a line graph, you can write: “The line graph illustrates changes in…” or “The line graph shows how… changed over the period.” For a bar chart, you might write: “The bar chart compares…” For a table, “The table presents data on…” often works well.
For a map, focus on location and change. For example: “The maps show how the town centre changed between 1990 and 2020.” For a process diagram, focus on the stages. For example: “The diagram illustrates the process by which glass bottles are recycled.” These patterns are simple because the task itself is simple.
If you are unsure which structure to use, choose the one that keeps the meaning closest to the original task statement. Accuracy beats variety.
Common Paraphrasing Mistakes In Task 1
The first mistake is changing key terms incorrectly. If the task says “the percentage of adults”, do not write “the number of people”. Percentages and numbers are different. If the task says “three age groups”, do not write “three generations” unless that is clearly true.
The second mistake is adding an overview inside the introduction. Phrases such as “increased dramatically” or “the most popular option” usually belong in the overview or body, not the introduction. Keep the introduction neutral.
The third mistake is making the sentence too long. Some candidates turn a simple task statement into a 40-word sentence with several clauses. Long sentences increase grammar risk. A clear one-sentence introduction is enough.
If paraphrasing and overview writing are both holding your score down, compare IELTS preparation plans and choose support that includes writing feedback on real Task 1 reports.
Sample Introduction For A Bar Chart
Task statement: The bar chart shows the percentage of people in four age groups who used public transport in 2022.
Sample introduction: The bar chart compares public transport use among four age groups in 2022, measured as a percentage of people.
This version is strong because it groups the information cleanly. It keeps “percentage” in the sentence, but places it at the end. It changes “shows” to “compares” because the chart compares age groups. It does not say which age group used transport most, because that belongs later.
Sample Introduction For A Table
Task statement: The table gives information about the average monthly spending of students in five categories in 2015 and 2025.
Sample introduction: The table presents the average amount students spent each month across five categories in 2015 and 2025.
This is a useful paraphrase because it changes the grammar but keeps the meaning. “Average monthly spending” becomes “the average amount students spent each month”. The time periods and number of categories remain unchanged. That is exactly what you want.
Sample Introduction For A Map Or Process
For maps, the safest introduction often mentions change. Task statement: The maps show the layout of a public park in 2000 and after redevelopment in 2020. Sample introduction: The maps illustrate how a public park changed after redevelopment between 2000 and 2020.
For a process, do not invent a time period. Task statement: The diagram shows how plastic bottles are recycled. Sample introduction: The diagram illustrates the process of recycling plastic bottles.
Maps and processes remind us that paraphrasing is not only vocabulary. It is also about choosing the right grammar. “How a park changed” works for maps. “The process of recycling” works for a process diagram.
A Simple Practice Method
Choose ten Task 1 questions. For each one, write only the introduction. Give yourself one minute per question. Then check whether your sentence keeps the visual type, subject, location, groups, and time period accurate.
Next, underline the words you changed. If you changed a key noun, ask whether the new word has exactly the same meaning. If not, change it back. This habit will protect you from the most common paraphrasing errors.
Finally, practise adding the overview immediately after the introduction. The IELTS Writing Task 1 sample answers page is useful for seeing how introductions lead into overview paragraphs and body paragraphs.
Final Checklist Before You Move On
Before you leave the introduction, ask five quick questions. Did I identify the visual correctly? Did I keep the same subject? Did I include the period or location if given? Did I avoid adding trends or reasons? Is the sentence clear on the first read?
If the answer is yes, move on. Do not waste five minutes polishing the first sentence while the overview and data paragraphs are unfinished. The introduction matters, but it is only one part of the report.
A good Task 1 introduction is accurate, calm, and efficient. It shows control without showing off. Once you can write it quickly, you free up time for the overview, comparisons, and selected data, where more of your score is won or lost.
Ready to find out your IELTS band score?
Take the IELTS Express Pre-Test for just $4.99 and get your personalised band prediction with a 14-day improvement plan.
FAQ: IELTS Writing Task 1 Paraphrasing Introduction Sample Answer
How long should a Task 1 introduction be?
One clear sentence is usually enough. It should identify what the visual shows without adding trends, reasons, opinions, or detailed figures.
Can I copy words from the Task 1 question?
You can keep some key words if changing them would be inaccurate. Paraphrasing does not mean replacing every word. Accuracy is more important than forced synonyms.
What is the safest verb for Task 1 introductions?
“Shows” is always acceptable, and “illustrates” is also useful. Use “compares” when the chart clearly compares groups, categories, or time periods.
Should I include numbers in the introduction?
Usually no. The introduction should describe the visual. Put detailed numbers in the body paragraphs and broad trends in the overview.
How can I practise paraphrasing introductions quickly?
Write introductions for ten Task 1 questions with a one-minute limit for each. Then check whether your sentence kept the original meaning exactly.